
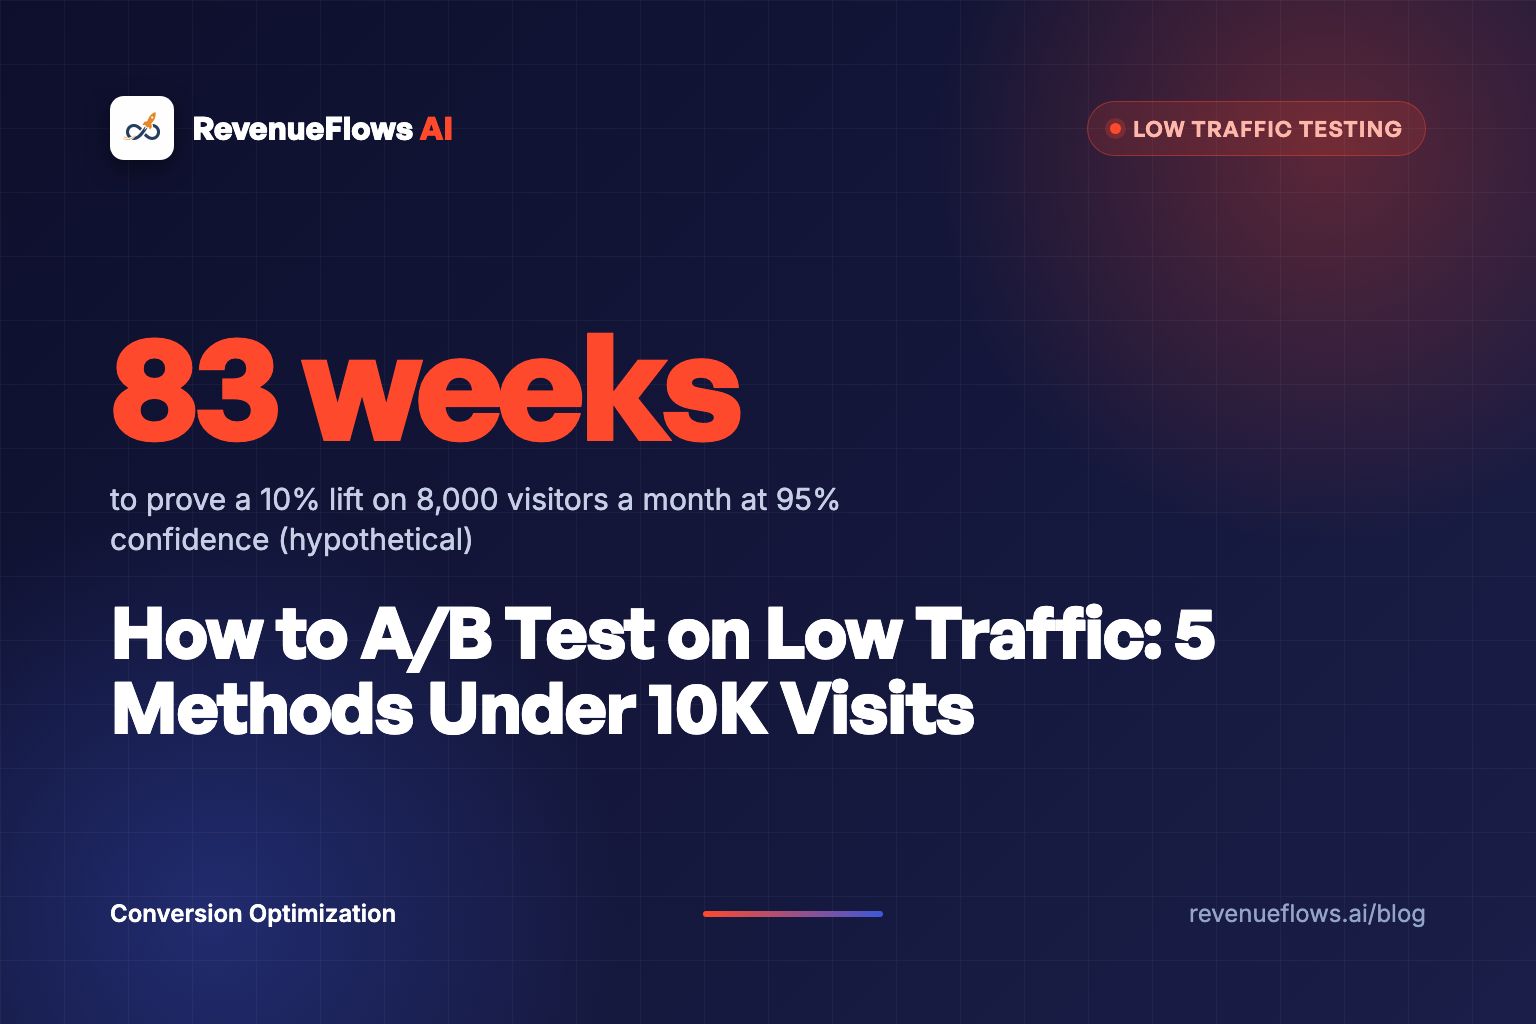
How to A/B Test on Low Traffic: 5 Methods Under 10K Visits
You were told you need 100,000 visitors to run a test. You need bigger ideas, a money metric and a confidence bar that fits a small store. Here's the math.

Somebody told you that you need 100,000 visitors before a test means anything. They were half right.
You need that much traffic to prove a small idea. You don't need it to prove a big one. Ab testing low traffic stores works when you flip three defaults: test bigger swings, judge them on revenue per visitor, and accept 90% confidence on changes you can undo, instead of waiting a year and a half for 95%.
Here are the 5 methods that work under 10,000 visits a month:
- Only test changes that could move revenue per visitor 30% or more.
- Drop to 90% confidence for reversible page changes.
- Pick the winner on revenue per visitor, not conversion rate.
- Pool traffic: test one template across every product page.
- Set a stop date and decide on the odds.
Low traffic doesn't kill testing. It kills testing small ideas. Those are different problems.
Why does ab testing low traffic stores feel impossible?
Because the advice you read was written for stores with 50 times your traffic.
I've sat across from founders doing $14,000 a month who spent three months testing a green button against an orange one. The test never finished. Nobody ever told them it couldn't.
Here's the math. Evan Miller, whose calculators half the testing world uses, gives a rule of thumb in How Not to Run an A/B Test: visitors per version equals 16 times the variance, divided by the square of the difference you want to detect. That's at 5% significance and 80% power. For a conversion rate, the variance is the rate times one minus the rate.
Run the math on a store like this, a hypothetical: 8,000 visitors a month to its product pages, converting at 2.0%. That's about 1,846 visitors a week.
| Lift you want to detect | Visitors per version at 95% | Weeks at 95% | Visitors per version at 90% | Weeks at 90% |
|---|---|---|---|---|
| 10% (2.0% to 2.2%) | 76,920 | 83.3 | 60,590 | 65.6 |
| 20% (2.0% to 2.4%) | 19,230 | 20.8 | 15,148 | 16.4 |
| 30% (2.0% to 2.6%) | 8,547 | 9.3 | 6,733 | 7.3 |
| 50% (2.0% to 3.0%) | 3,077 | 3.3 | 2,424 | 2.6 |
Weeks assume both versions share the 1,846 weekly visitors. The 95% column uses the exact constant behind Miller's 16, which is 15.7 before he rounds it. The 90% column uses 12.4, the same formula with the 90% z-score swapped in. Check any row in Evan Miller's sample size calculator, which lets you set the significance level and power yourself.
Look at that first row. 83 weeks. A button color test on this store finishes sometime in 2028.
Two versions, 2.0% baseline conversion rate, Evan Miller's rule of thumb at 80% power.
Method 1: Why should you only test big swings?
Because halving the lift you want to detect roughly quadruples the traffic you need. The size of the idea decides whether the test can finish. Your store size doesn't.
Intelligems puts it plainly in its guide to minimum traffic for a meaningful test: the size of the change matters more than the size of the store.
So what counts as big? Not a font. Not a badge. A different offer. A bundle where there was a single unit. A first screen that answers the buyer's real question ("will this fix my neck pain or is it another $60 pillow I'll hate?") instead of listing foam density.
Run the math on a big swing, still the hypothetical store. Control: conversion rate 2.0%, average order value $70. That means revenue per visitor is $1.40. On 10,000 visitors, that's $14,000.
The variant adds a two-pack bundle and rewrites the first screen. Conversion rate 2.6%, average order value $84. That means revenue per visitor is $2.18. On the same 10,000 visitors, that's $21,840.
Conversion rate x average order value x visitors. Control 2.0% x $70. Variant 2.6% x $84.
Watch what happens. Conversion rate rose 30%. Average order value rose 20%. Revenue per visitor rose 56%, because 1.3 times 1.2 is 1.56. Two levers moving together compound. That's the kind of gap a small store can actually see.
A button test on a small store is a coin you'll never finish flipping. A rebuilt page is a coin with two heads.
This is where AI changed the math for small stores. A real challenger page used to mean weeks of copy, photos and design, so stores tested buttons because buttons were cheap. Now you can paste 200 reviews into any chat assistant and ask for the three objections buyers mention most. And with RevenueFlows AI you drop in a product URL and the AI writes the copy, designs the images and builds the page in less than 15 minutes. The bold variant is no longer the expensive one.
Method 2: Is 90% confidence good enough?
For a change you can undo next week, yes.
95% confidence means that if the two pages were truly identical, you'd get a false alarm about 1 time in 20. At 90% it's about 1 time in 10. In exchange, you need roughly 21% fewer visitors.
Seer Interactive's guide on not having enough traffic to A/B test says some of the best testing companies are happy with tests at 90% significance, or even less, while warning that lower significance means more risk the result is luck. Clean Commit's low traffic store guide calls 95% a big-traffic luxury and allows 85% or 90% for reversible changes.
Two versions, 2.0% baseline conversion rate, 80% power. 90% confidence needs about 21% fewer visitors.
Here's the thing most posts skip. 90% only buys you about a fifth off the clock. On the 30% swing it saves two weeks, 9.3 down to 7.3. On a 10% button test it takes you from 83 weeks to 66. Still hopeless.
So my rule: 90% is a discount on a good test. It doesn't rescue a bad one. Keep 95% for permanent, expensive bets, like a price change across the whole catalog.
Method 3: Which metric should pick the winner?
Revenue per visitor. Conversion rate times average order value.
A variant can win on conversion rate and lose money. Picture a hypothetical where version B converts at 2.4% with a $55 average order value. Revenue per visitor is $1.32. Version A, 2.0% at $70, is $1.40. B wins the conversion rate report and costs you $800 on every 10,000 visitors ($13,200 instead of $14,000). The full argument is in revenue per visitor vs conversion rate.
Honest caveat: revenue per visitor is noisier than conversion rate, because order sizes swing. That's one more reason Method 1 matters. Big swings punch through noise.
You can still use a faster early read. Clean Commit notes that add to cart rate reaches significance roughly three times faster than purchase rate. Watch it in week one to catch a broken variant. Then decide on revenue per visitor.
Method 4: How do you pool traffic you already have?
Stop testing one page at a time.
Say the hypothetical store's 8,000 monthly product page visitors are spread over 12 products, and the hero gets 3,100 of them. To catch a 30% lift at 90% confidence you need 13,466 visitors total. On the hero alone, that's 4.3 months. Test the same change on the product template across all 12 products and it's 7.3 weeks.
Wingify's list of techniques for low traffic sites makes the same call: run site-wide tests and forget multivariate tests. Every extra version splits your traffic thinner, so test two versions. One control, one challenger.
This works when the change is structural (a new first-screen layout, a bundle block, a guarantee section) and applies to every product. It fails when the change only makes sense for one product's buyer. If your theme can't ship a template change like that, I compared the builders that can in the best Shopify page builder for conversions in 2026.
Method 5: How do you decide without waiting forever?
Set the stop date before launch. Then decide on the odds.
Here's the trap. Intelligems' own docs on statistical significance recommend 300+ orders per test group and 7+ days. At a 2.0% conversion rate, 300 orders per group is 15,000 visitors per group, 30,000 total. On 8,000 visitors a month, that's 3.75 months. Their blog calls a couple hundred orders per variant a reference, not a gate.
So pick the stop date from the sample size table. Never shorter than two full weeks, so every weekday and weekend is in the data twice. If the table says more than about eight weeks, the idea is too small for your store. Make it bigger or ship it without a test.
On the stop date, read the probability to beat control on revenue per visitor. Intelligems defines it as the probability that a test group is better than the control on the selected metric. Ship at 90% or higher if the change is reversible. And make sure the reading held steady for several days, the same brake Shoplift builds in before it assigns a result. Never stop early because day four looked great. Miller's essay shows that checking a no-difference test over and over and stopping the moment it looks significant pushes the false positive rate to 26.1%.
The deeper version of this decision lives in Bayesian vs frequentist A/B testing. If you'd rather earn during the test than prove a winner, read multi-armed bandit vs A/B testing.
Pick the stop date while you're calm. Read the odds on that date. Anything else is reading tea leaves on day four.
What does a big swing look like on a real store?
Real client numbers, not typical results, and not a promise of what your store will do. On one bedding product, Adjustable Pillows, conversion rate went from 1.0% to 4.4% and average order value went from $125 to $152. Revenue per visitor went from $1.25 to $6.68. On 10,000 visitors, that's $66,800 instead of $12,500. You can see the full case study numbers.
That page wasn't tweaked. It was rebuilt. And a gap that size doesn't need 83 weeks or a statistician. Any method sees it fast.
For the full testing playbook, start with the ecommerce A/B testing guide. To pick an app with honest stats, see the best Shopify A/B testing apps, ranked by rigor, and for the step-by-step setup on one page, read how to A/B test your Shopify product page.
What to do next
Open your analytics and find the one number that decides everything: monthly visitors to your hero product page. Divide 13,466 by it. If the answer is under two months, you can run a real 90% test on a 30% swing right now. If it's more, test the template across every product instead.
Book Your Profit Audit
On a small store, the test you can afford is the bold one, and the bold one is a rebuilt page. Book a free profit audit and we'll show you where your revenue per visitor is leaking, then show you how to rebuild a high-converting product sales page in less than 15 minutes.
Or go here to check it out → revenueflows.ai
P.S. A small store testing small ideas waits forever. A small store testing big ideas gets an answer this month.
Frequently asked questions
Can you A/B test with low traffic?
Yes, if you change what you test. Under 10,000 visitors a month you can't prove small lifts, so test changes big enough to move revenue per visitor 30% or more, put the test where the traffic already is, and decide on a confidence bar before you launch.
How many visitors do you need for an A/B test?
It depends on the lift you want to detect. On a page converting at 2%, Evan Miller's rule of thumb at 95% confidence and 80% power needs about 19,230 visitors per version to catch a 20% lift, but only about 3,077 per version to catch a 50% lift.
Is 90% confidence good enough for an A/B test?
For a reversible page change on a small store, usually yes. At 90% you accept a false alarm about 1 time in 10 instead of 1 in 20, and in return you need roughly 21% fewer visitors. Keep 95% for permanent, expensive bets like a price change across the catalog.
What metric should a low traffic A/B test use?
Decide the winner on revenue per visitor, which is conversion rate times average order value. You can watch add to cart rate as an early read because it happens more often, but a variant that wins on clicks and loses on order size is a loser.
How long should a low traffic A/B test run?
Set the stop date before launch, never shorter than two full weeks, and use the sample size math to pick it. If the math says the test needs more than about eight weeks, the change is too small for your traffic, so make it bigger or ship it without a test.